Topic 3.4: Sine and Cosine Function Graphs
In previous topics, we viewed sine and cosine as static coordinates on a circle. In Topic 3.4, we “unroll” the circle to view these values as functions of the angle $$\theta$$.
As $$\theta$$ increases (moving counterclockwise around the circle), the vertical displacement (sine) and horizontal displacement (cosine) oscillate. This means they repeat a specific pattern of values between $$-1$$ and $$1$$ over and over again.
The Sine Function: $$f(\theta) = \sin \theta$$
The sine function tracks the vertical displacement ($$y$$-coordinate) of a point on the unit circle.
- Domain: All real numbers $$(-\infty, \infty)$$ because you can rotate around the circle forever in either direction.
- Range: $$[-1, 1]$$ because a point on the unit circle can never be higher than 1 or lower than -1.
- Starting Point: Since $$\sin(0) = 0$$, the parent sine graph starts at the origin (midline) and moves upward.
The Cosine Function: $$f(\theta) = \cos \theta$$
The cosine function tracks the horizontal displacement ($$x$$-coordinate) of a point on the unit circle.
- Domain: All real numbers $$(-\infty, \infty)$$.
- Range: $$[-1, 1]$$.
- Starting Point: Since $$\cos(0) = 1$$, the parent cosine graph starts at its maximum value.
Worked Example: Tracking the “Five Key Points”
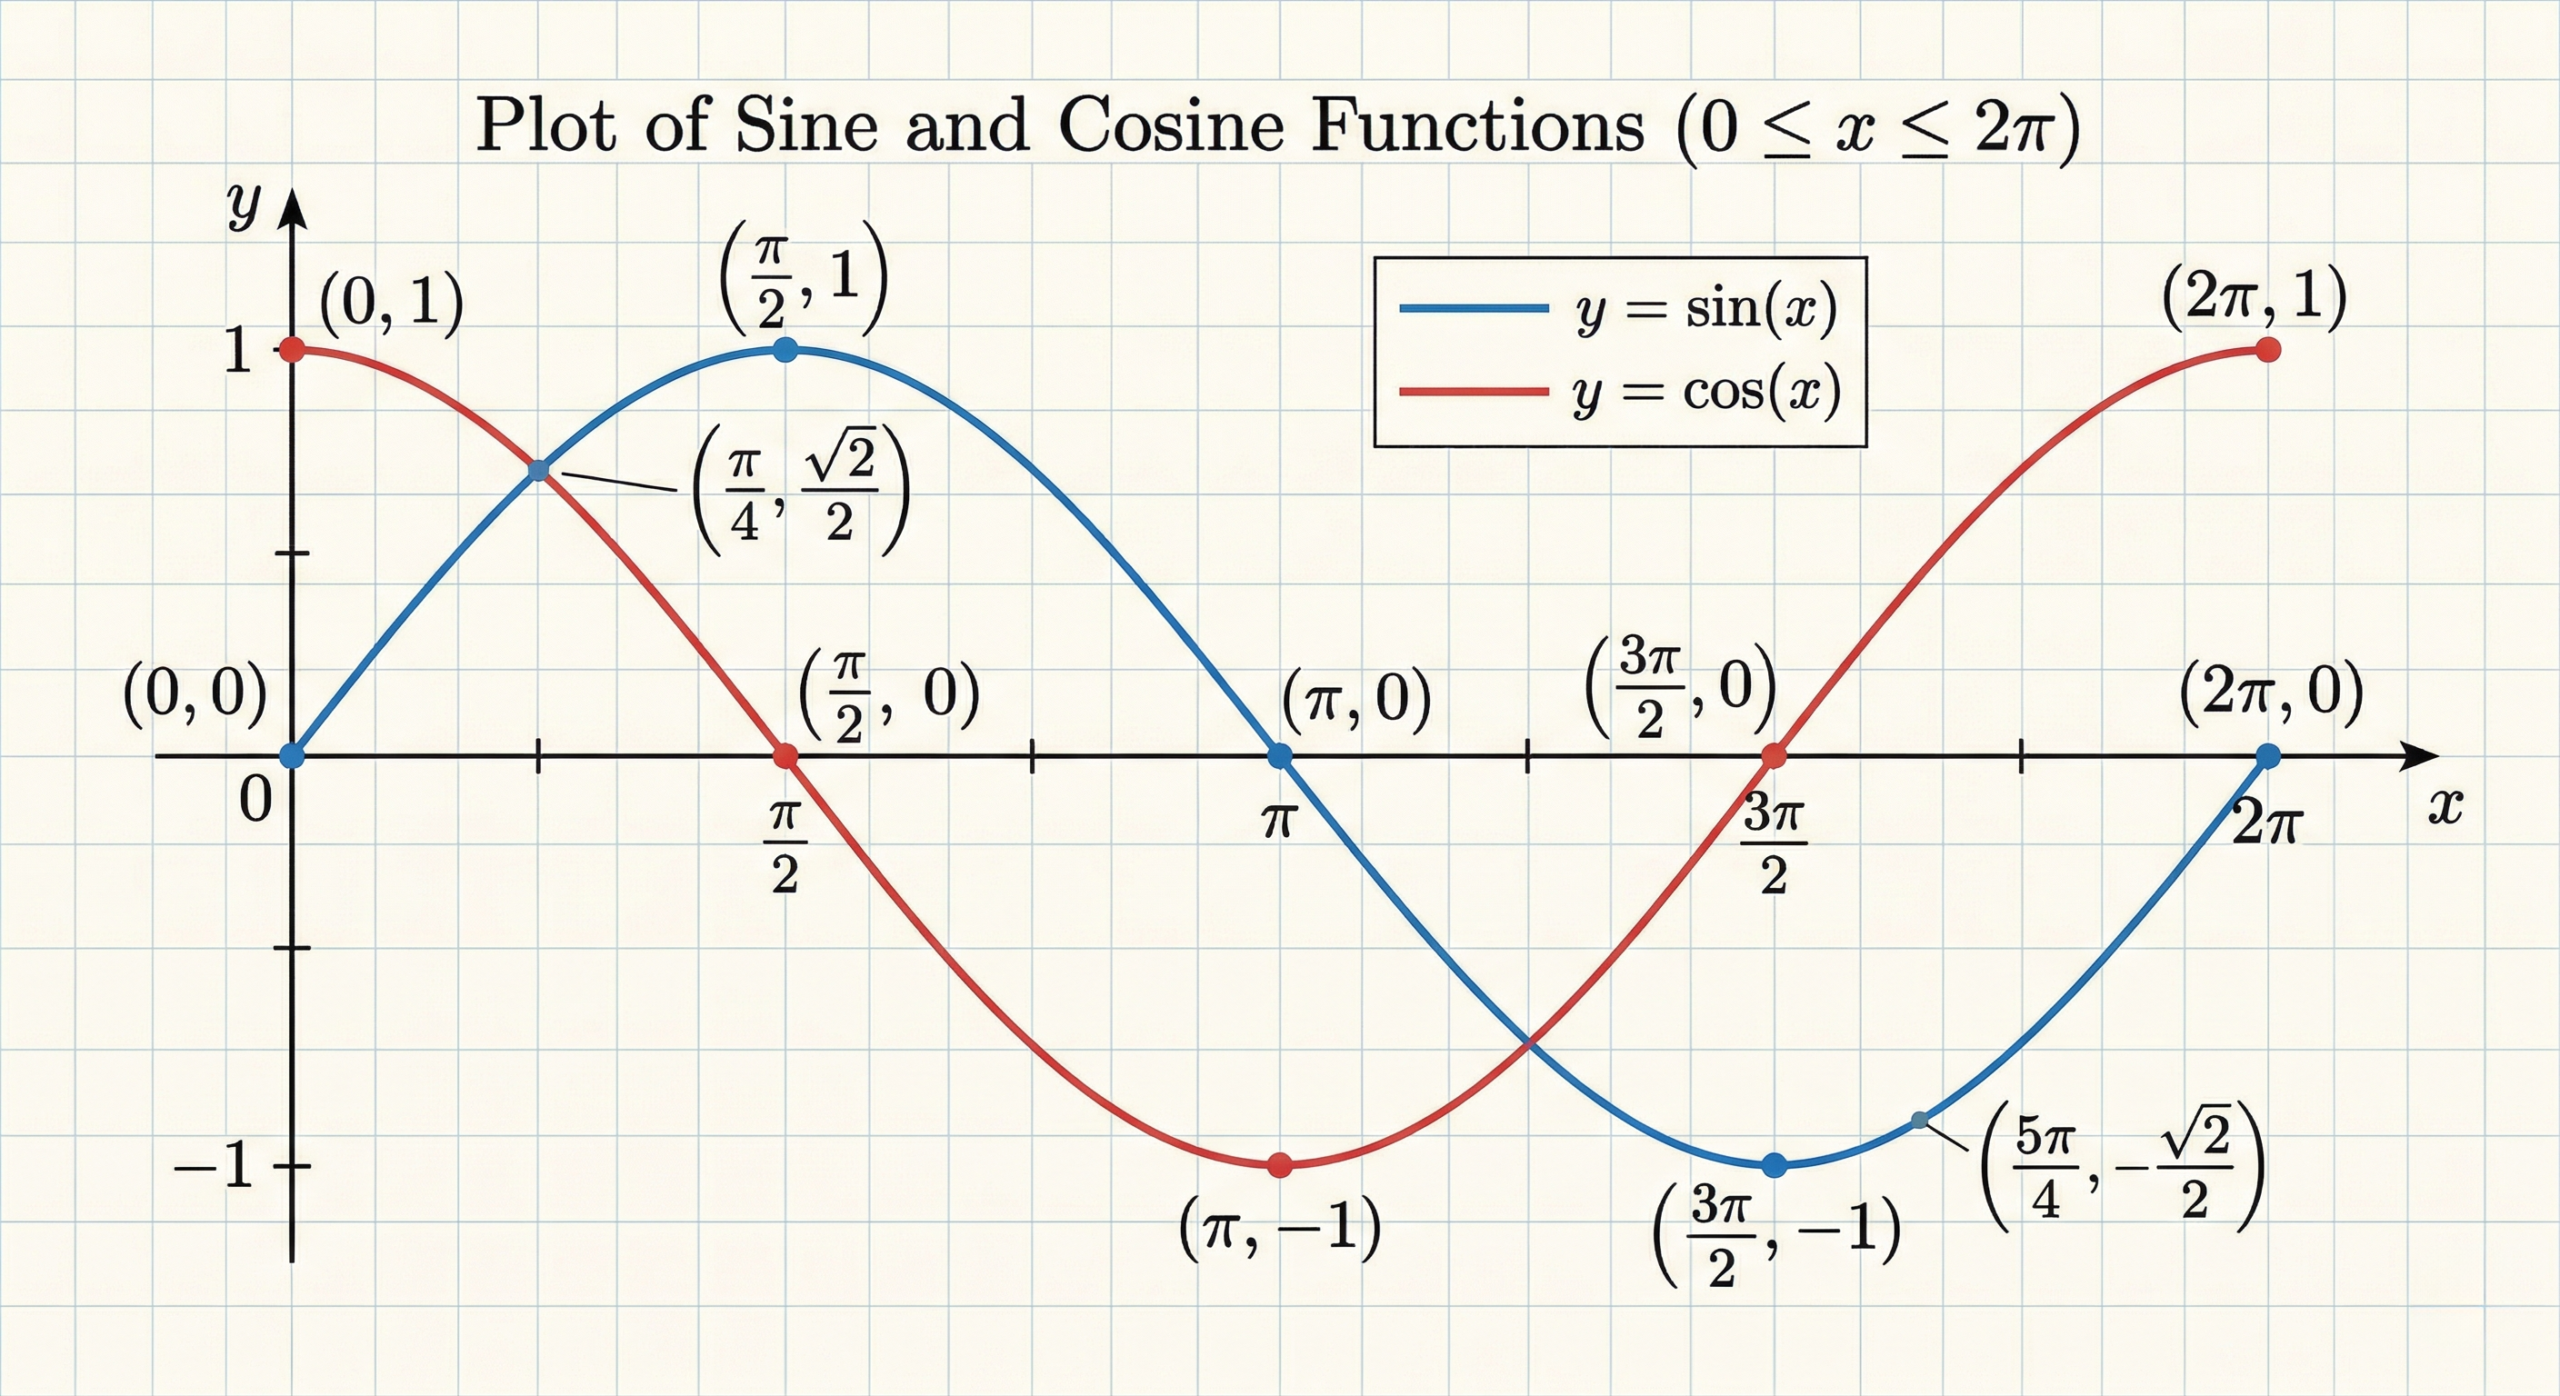
To graph one full period ($$2\pi$$) of $$y = \sin \theta$$, we track the $$y$$-coordinates at the quadrantal angles. Complete the table and describe the movement.
Solution
| Angle ($$\theta$$) | $$0$$ | $$\pi/2$$ | $$\pi$$ | $$3\pi/2$$ | $$2\pi$$ |
|---|---|---|---|---|---|
| $$\sin \theta$$ ($$y$$-coord) | $$0$$ | $$1$$ | $$0$$ | $$-1$$ | $$0$$ |
Movement Description:
The graph starts at the midline, rises to its peak at $$\pi/2$$, returns to the midline at $$\pi$$, drops to its trough at $$3\pi/2$$, and finishes the cycle back at the midline at $$2\pi$$.
Comparison: Sine vs. Cosine Behavior
While both graphs have the same shape (sinusoidal), they are “out of phase” with each other.
| Characteristic | Sine ($$y = \sin \theta$$) | Cosine ($$y = \cos \theta$$) |
|---|---|---|
| Value at $$\theta = 0$$ | $$0$$ (Midline) | $$1$$ (Maximum) |
| Symmetry | Odd (Origin Symmetry) | Even ($$y$$-axis Symmetry) |
| $$x$$-intercepts (on $$[0, 2\pi]$$) | $$0, \pi, 2\pi$$ | $$\pi/2, 3\pi/2$$ |
Did you notice the graphs look identical if you just slide one over? Mathematically, $$\sin \theta = \cos(\theta – \pi/2)$$. This confirms that the sine function is simply a cosine function shifted $$\pi/2$$ units to the right.
Worked Example: Identifying Concavity and Rates of Change
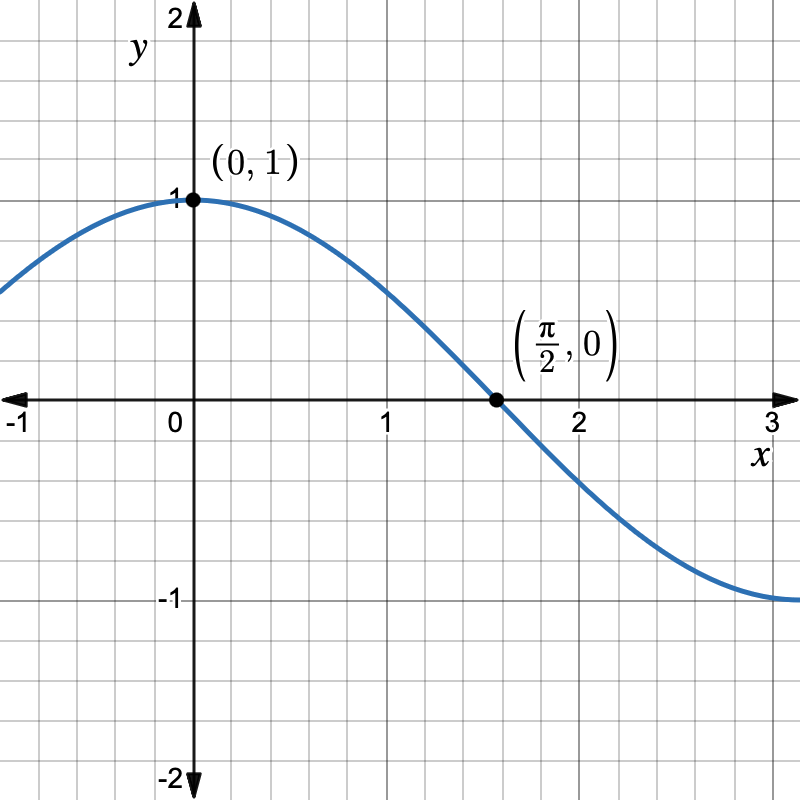
On the interval $$(0, \pi/2)$$, describe the behavior of $$f(\theta) = \cos \theta$$ in terms of increase/decrease and concavity.
Solution
Values: At $$0$$, $$\cos(0)=1$$. At $$\pi/2$$, $$\cos(\pi/2)=0$$.
Increase/Decrease: Since the value goes from $$1$$ to $$0$$, the function is decreasing.
Concavity: Look at the unit circle. As you move from the top of the circle ($$x=1$$) toward the side ($$x=0$$), the horizontal distance decreases faster and faster.
Result: The graph is concave down on $$(0, \pi/2)$$.
Parent Period: Both sine and cosine have a natural period of $$2\pi$$ (one full revolution).
Sine Tracks $$y$$: It starts at the origin, oscillates between $$-1$$ and $$1$$.
Cosine Tracks $$x$$: It starts at its maximum ($$1$$), oscillations between $$-1$$ and $$1$$.
Continuity: Both functions are continuous for all real numbers; there are no holes or asymptotes.
Sinusoidal Nature: Both graphs are “waves” that take on every possible value between their minimum and maximum in every cycle.
Advanced Mastery Assessment (MCQ)
Question 1
Which of the following intervals describes where $$f(\theta) = \sin \theta$$ is both decreasing and concave down?
(A) $$(0, \pi/2)$$
(B) $$(\pi/2, \pi)$$
(C) $$(\pi, 3\pi/2)$$
(D) $$(3\pi/2, 2\pi)$$
Click for Solution
Step 1: Sine decreases when the $$y$$-value on the circle goes down (Quadrants II and III).
Step 2: A graph is concave down when it is “frowning” (above the midline).
Step 3: Quadrant II ($$(\pi/2, \pi)$$) is where the graph is moving from the peak ($$1$$) back to the midline ($$0$$)—decreasing and concave down.
Correct Answer: (B)
Question 2
At which value of $$theta$$ does the graph of $$y = \cos \theta$$ have an $$x$$-intercept?
(A) $$\pi$$
(B) $$2\pi$$
(C) $$3\pi/2$$
(D) $$0$$
Click for Solution
Step 1: An $$x$$-intercept occurs where the output (cosine) is $$0$$.
Step 2: $$\cos \theta = 0$$ when the $$x$$-coordinate on the unit circle is $$0$$.
Step 3: This occurs at $$\pi/2$$ and $$3\pi/2$$.
Correct Answer: (C)
Question 3
What is the range of the function $$g(\theta) = \sin \theta$$ if the domain is restricted to the interval $$[\pi/2, 3\pi/2]$$?
(A) $$[0, 1]$$
(B) $$[-1, 0]$$
(C) $$[-1, 1]$$
(D) $${0}$$
Click for Solution
Step 1: At $$\pi/2$$, $$\sin \theta = 1$$.
Step 2: At $$\pi$$, $$\sin \theta = 0$$.
Step 3: At $$3\pi/2$$, $$\sin \theta = -1$$.
Step 4: The function covers all values between the max ($$1$$) and min ($$-1$$) on this interval.
Correct Answer: (C)
If you were to graph $$y = (\sin \theta)^2$$, would the range still be $$[-1, 1]$$? Why or why not? How would the periodicity of the graph change?