Phase diagrams are a powerful way to visualize the conditions under which solids, liquids, and gases exist and transition from one state to another. Phase diagrams help us understand not only everyday phenomena like boiling and freezing but also more advanced ideas such as the critical point, triple point, and supercritical fluids.
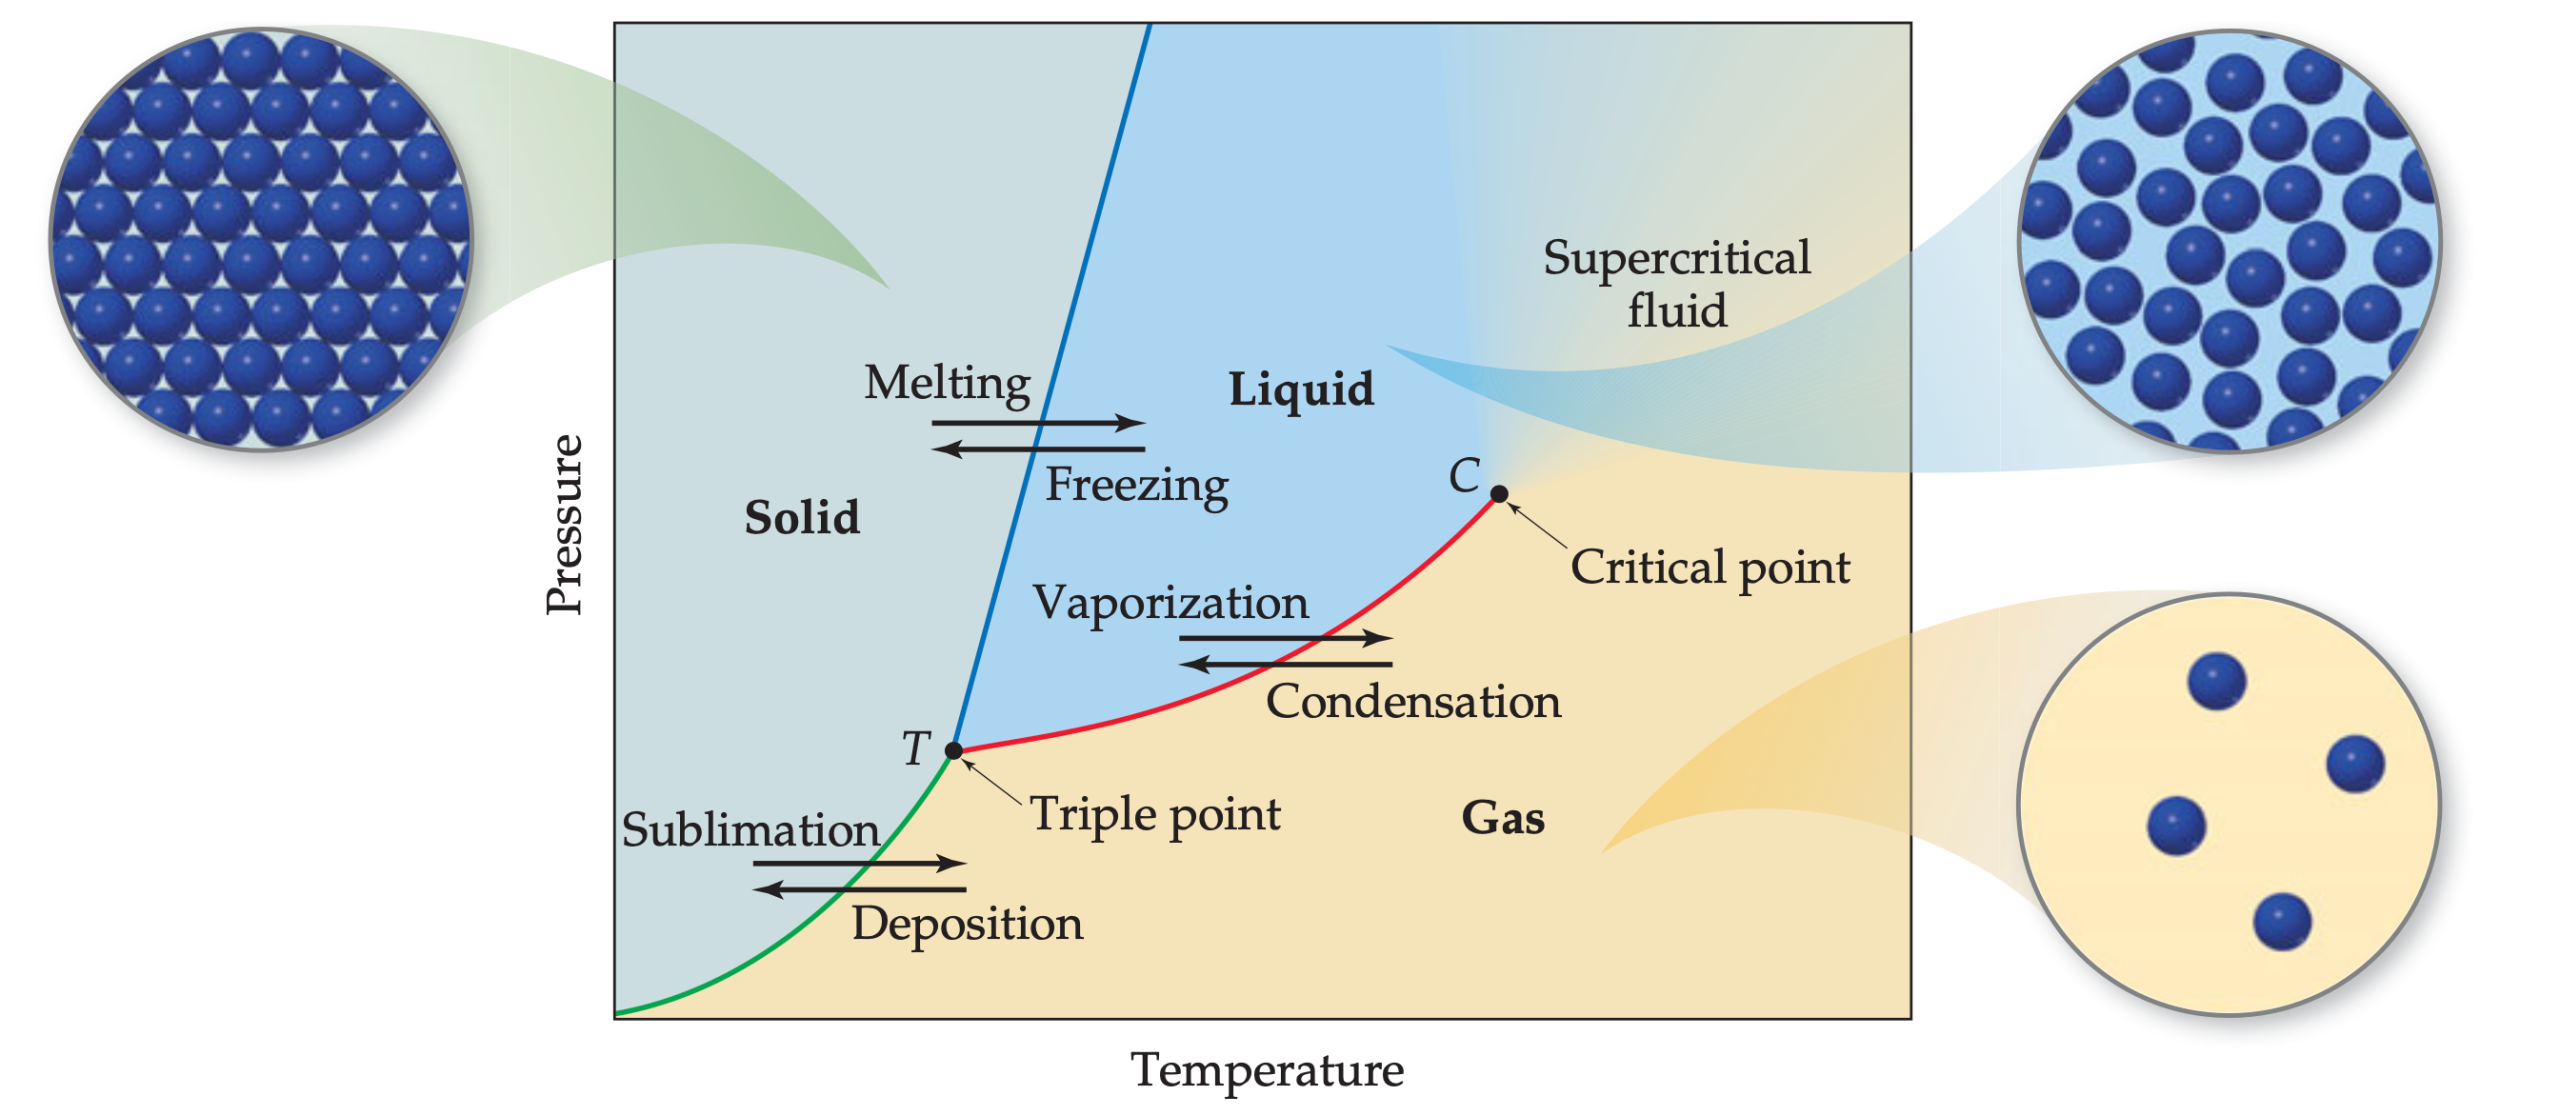
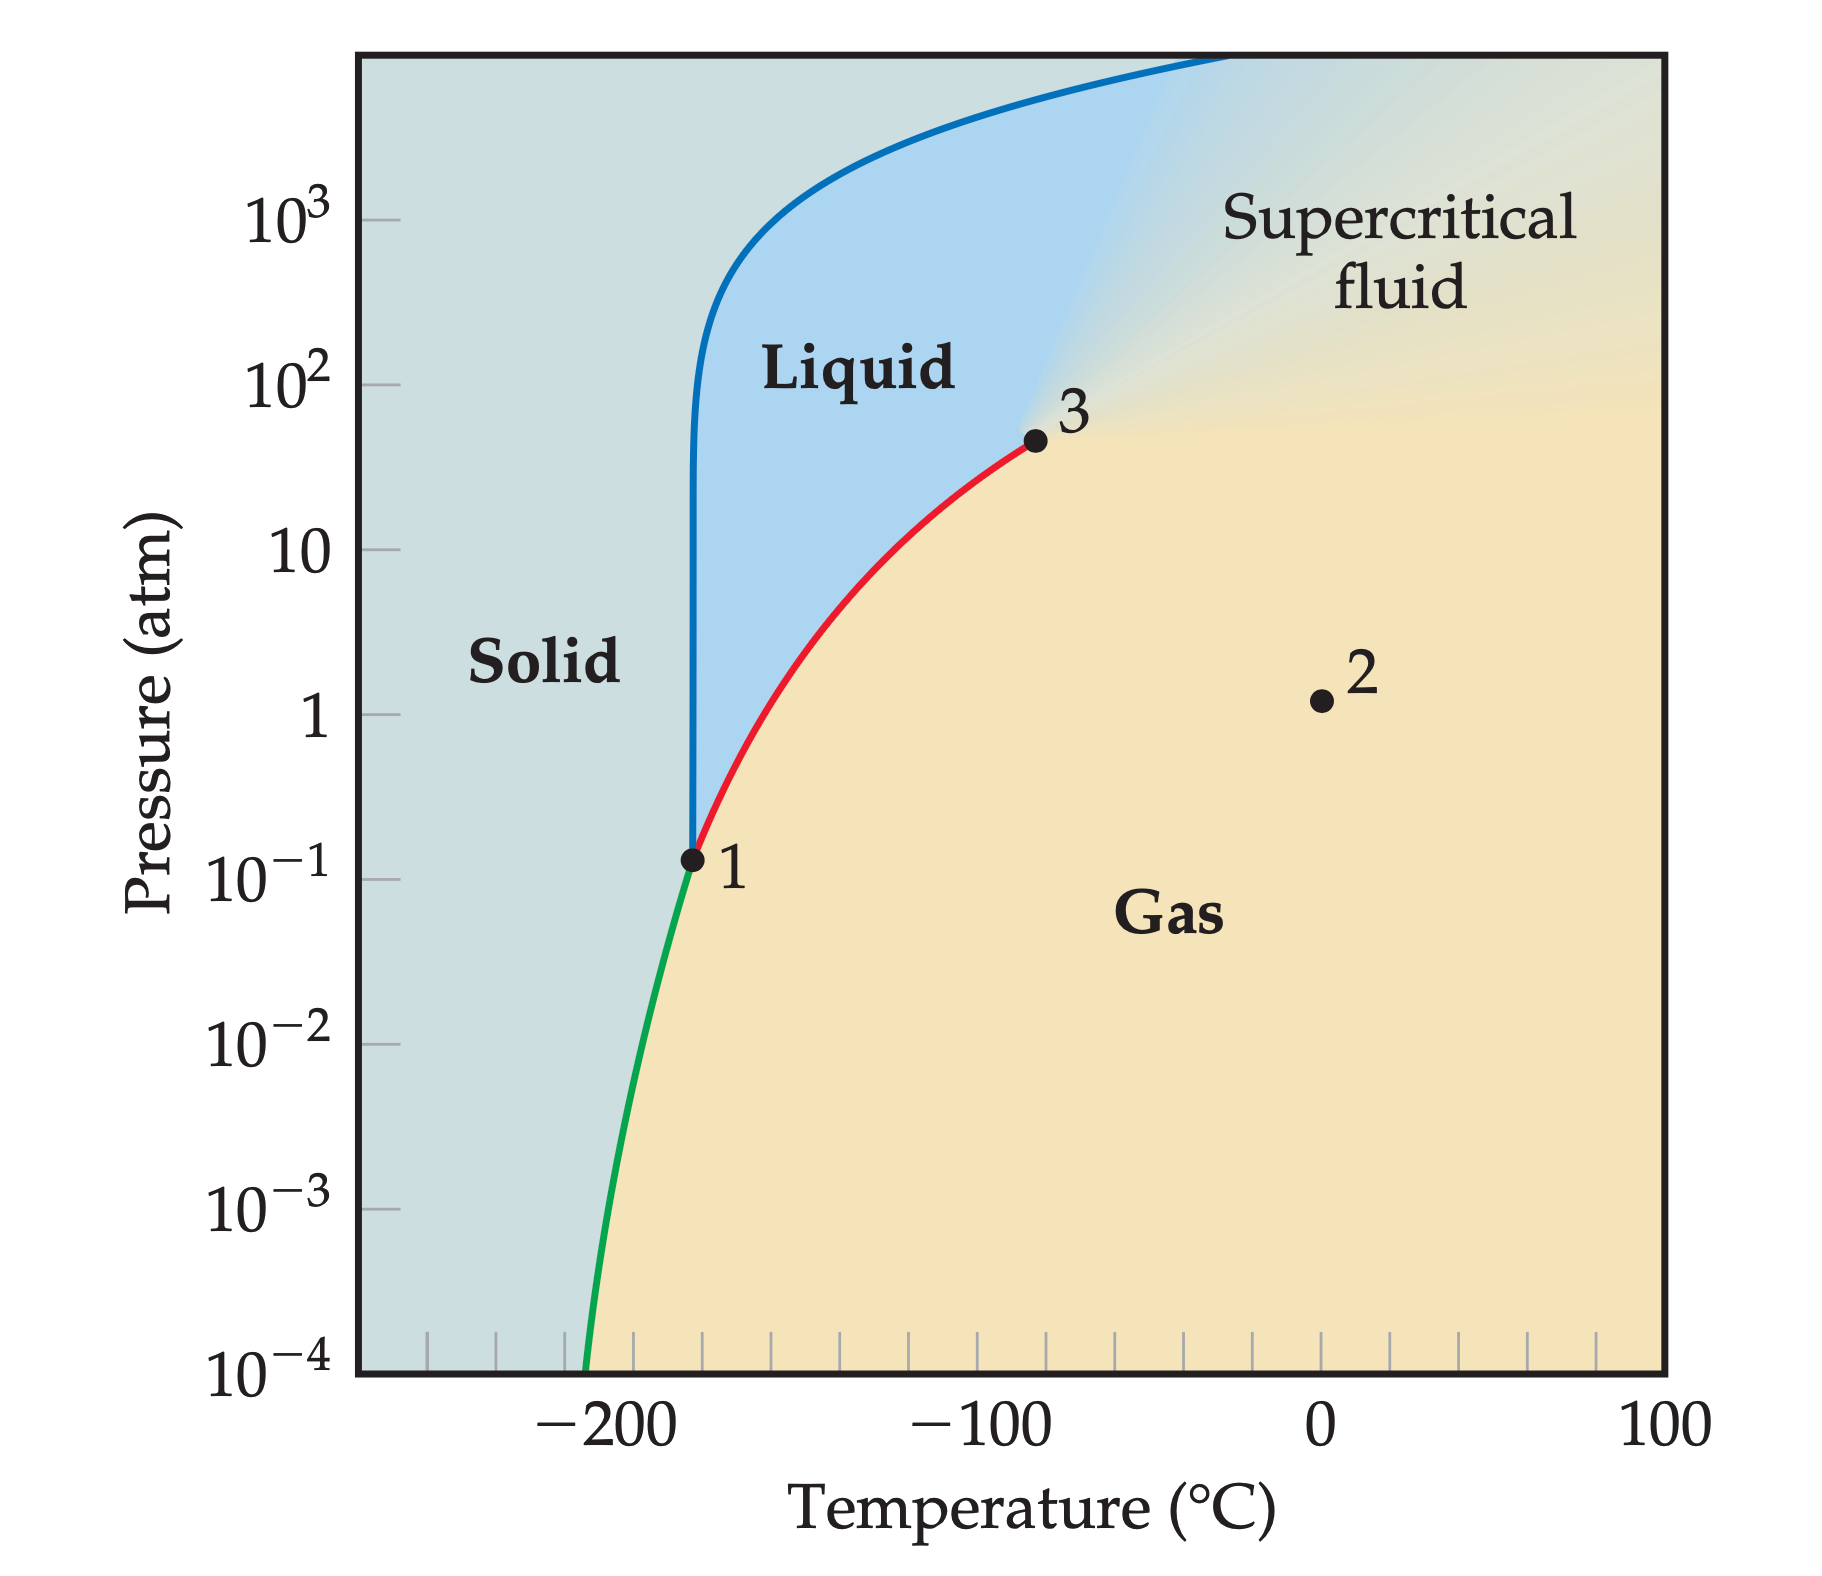
sublimation curve, the blue line is the melting curve, and the red line is the vapor pressure curve.
What is a Phase Diagram?
A phase diagram is a graph that shows the regions of stability of the three phases of matter — solid, liquid, and gas — under varying temperature and pressure. Each curve on the diagram represents conditions where two phases coexist in equilibrium. The three most important curves are:
- Vapor-Pressure Curve (red line): Separates liquid and gas. It ends at the critical point, beyond which liquid and gas become indistinguishable, forming a supercritical fluid.
- Sublimation Curve (green line): Separates solid and gas, showing where sublimation and deposition occur.
- Melting Curve (blue line): Separates solid and liquid. For most substances it slopes slightly to the right, but for water it slopes left due to the unusual density relationship between ice and liquid water.
Key Points on the Phase Diagram
- Triple Point (T): The unique temperature and pressure at which solid, liquid, and gas coexist in equilibrium.
- Critical Point (C): The end of the vapor-pressure curve. Beyond this, the difference between liquid and gas disappears.
Proof: Why the Triple Point is Unique
By definition, the triple point is where all three equilibrium curves meet. To prove its uniqueness, consider the following:
At the triple point, \(P_T\) and \(T_T\) satisfy simultaneously:
\(f_{\text{solid}}(P_T,T_T)=f_{\text{liquid}}(P_T,T_T)=f_{\text{gas}}(P_T,T_T),\)
where \(f\) represents the Gibbs free energy of each phase. Since Gibbs free energy equality defines equilibrium between phases, the triple point is the only condition at which all three equations hold true at once. Thus, it is unique for each substance.
Examples with Adjusted Values
Example 1: Identifying a Phase Change
Suppose we have a liquid at 200 K and 1 atm. If pressure is increased while keeping temperature constant, the system will eventually cross the melting curve into the solid phase. This corresponds to freezing.
Example 2: Phase Diagram of Water (Adjusted)
In water’s phase diagram, the melting curve slopes to the left. This means that as pressure increases, the melting point decreases. For example, at 0 °C and 1 atm, ice melts into liquid water. At higher pressures (say 200 atm), ice melts at slightly lower temperatures, explaining why ice skating is possible—pressure from the blade lowers the melting point locally.
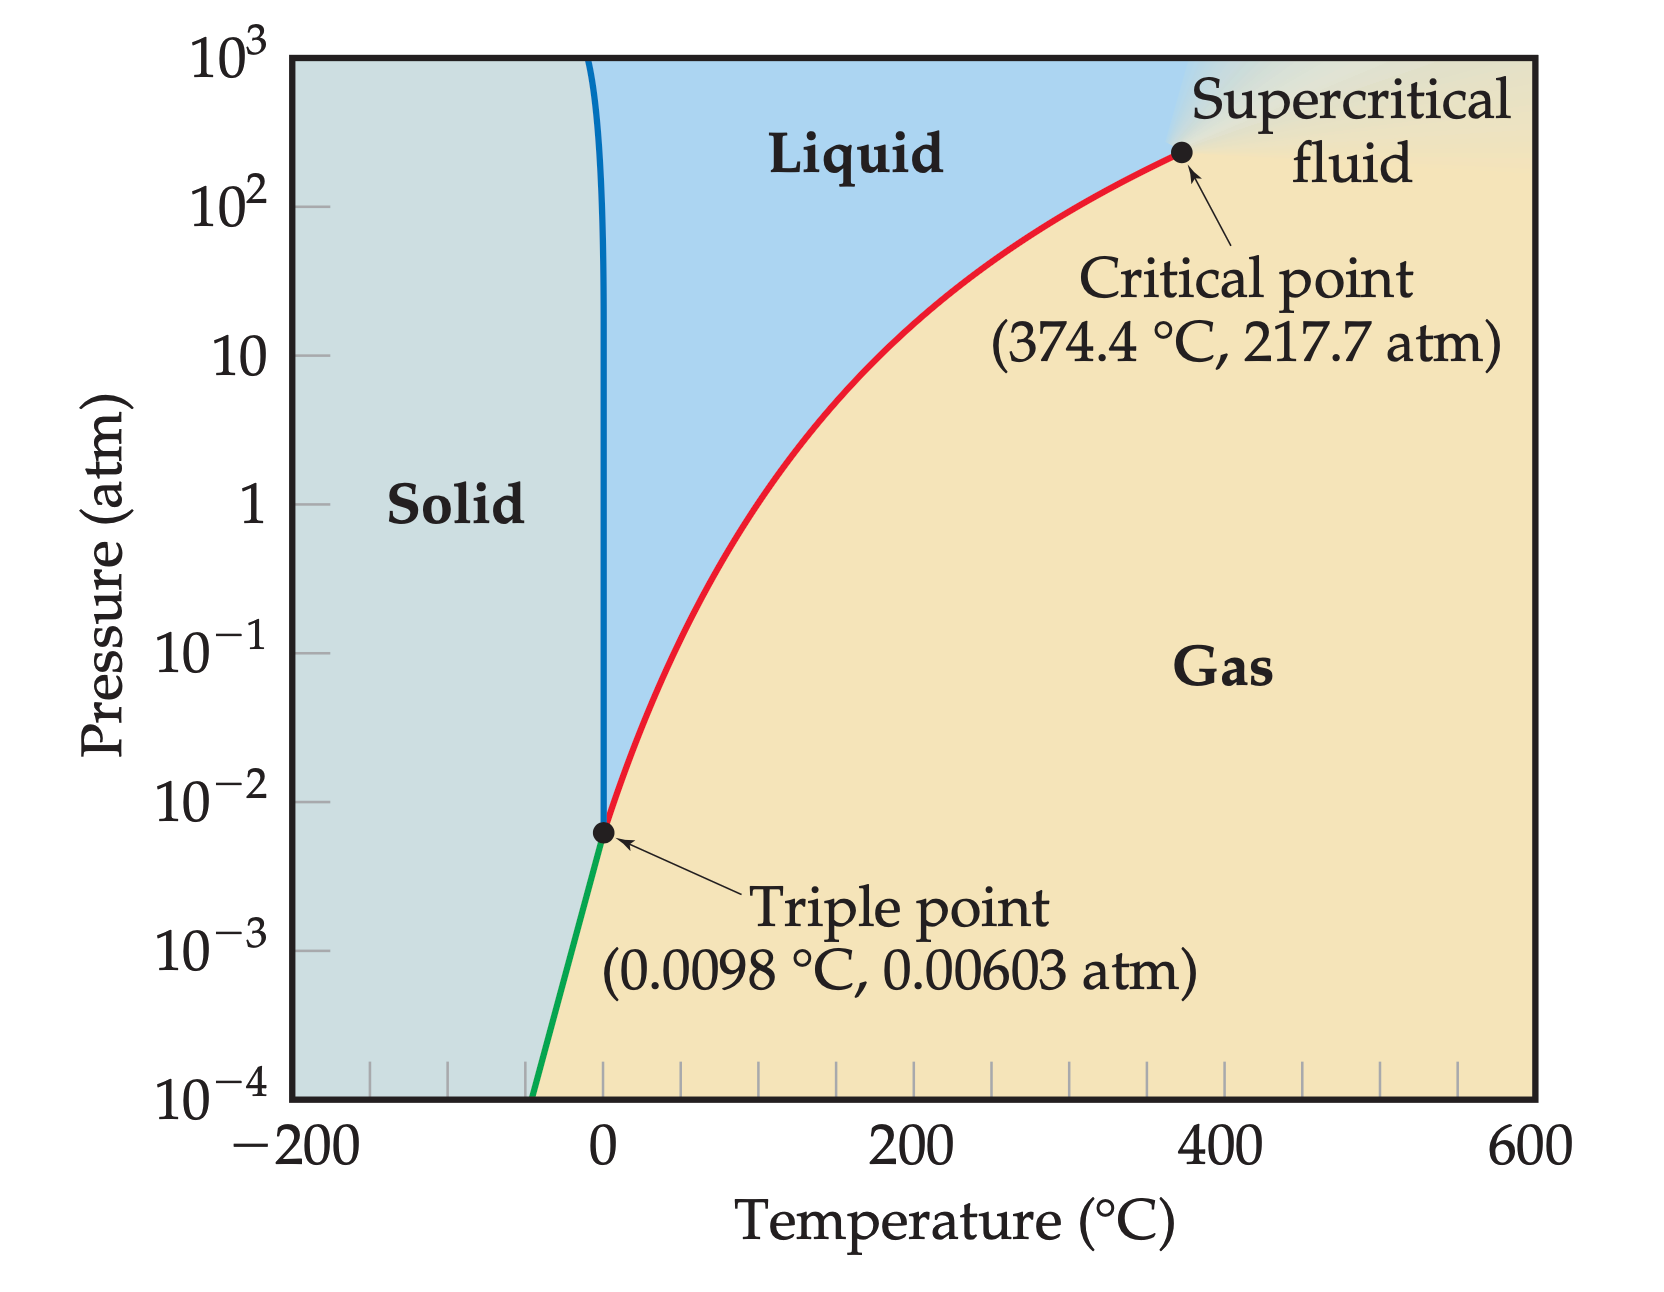
temperature and a logarithmic scale to
represent pressure.
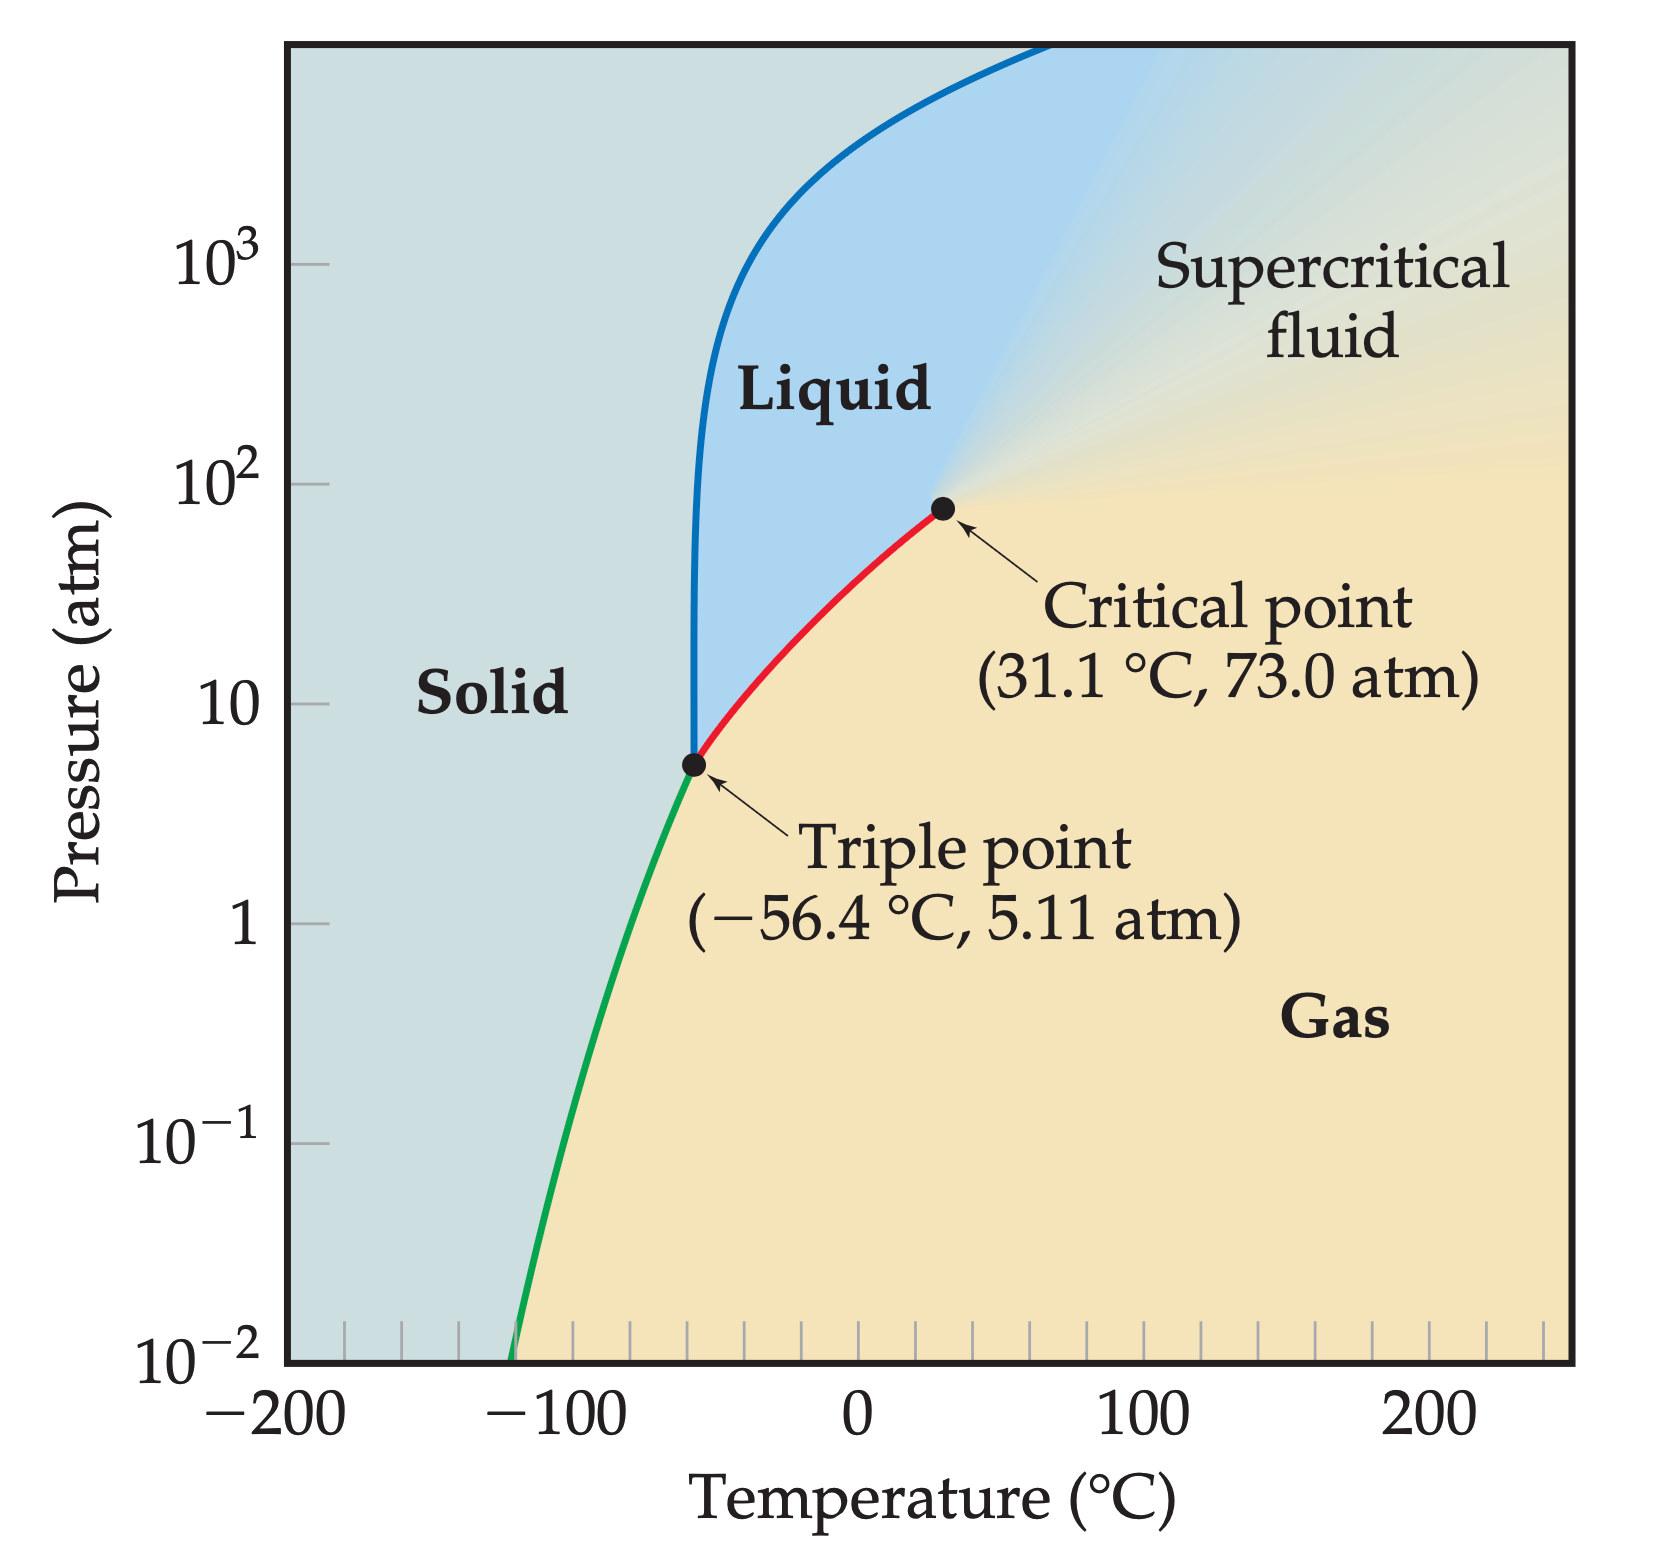
Example 3: Carbon Dioxide
Carbon dioxide does not have a normal liquid state at 1 atm. Instead, solid CO2 (dry ice) sublimates directly into gas at about \(-78.5^\circ\)C. This makes dry ice useful in cooling because it skips the liquid phase entirely.
Example 4: Methane
Using the methane phase diagram:
- Critical Point: About \(-80^\circ\)C and 50 atm.
- Triple Point: About \(-182^\circ\)C and 0.1 atm.
- Normal Boiling Point: \(-162^\circ\)C at 1 atm.
Thus, methane at 1 atm and \(-170^\circ\)C is a liquid, but at 1 atm and \(-100^\circ\)C it is a gas.
Practice Questions
- At what temperature and pressure does CO2 exist as a supercritical fluid?
- Why does the melting curve of water slope to the left, while that of CO2 slopes to the right?
- If methane is at 1 atm and \(-180^\circ\)C, what phase is present? What happens if the pressure is reduced further?
EXAMPLE — Methane Phase Diagram
Look at the phase diagram for methane (CH4) and answer:
- Where is the critical point (temperature and pressure)?
- Where is the triple point?
- At \(0^\circ \text{C}\) and \(1\ \text{atm}\), what phase is methane in?
- At \(1\ \text{atm}\), if solid methane is heated, what happens?
- If methane is at \(0^\circ \text{C}\) and \(1\ \text{atm}\) and we increase pressure, what phase will it become?
Answer
- Critical point: about \(-80^\circ \text{C}\) and \(50\ \text{atm}\).
- Triple point: about \(-180^\circ \text{C}\) and \(0.1\ \text{atm}\).
- At \(0^\circ \text{C}\) and \(1\ \text{atm}\), methane is a gas.
- At \(1\ \text{atm}\), solid methane melts into a liquid (around \(-180^\circ \text{C}\)) and then vaporizes into a gas (around \(-160^\circ \text{C}\)).
- Compressing methane at \(0^\circ \text{C}\) and \(1\ \text{atm}\) leads to a supercritical fluid at about \(50\ \text{atm}\).
Takeaway
Phase diagrams provide a roadmap of matter under different pressures and temperatures. By studying them, we can predict phase transitions, understand unique properties of substances like water and CO2, and even design applications in cryogenics and energy storage.
For more information, check out Khan Academy’s guide to states of matter. For a deeper dive into concepts like the critical point and phase diagrams, these resources provide excellent additional reading.
See also: Step-by-Step Guide to Electron Configurations for AP Chemistry Success


2 Comments.