Introduction
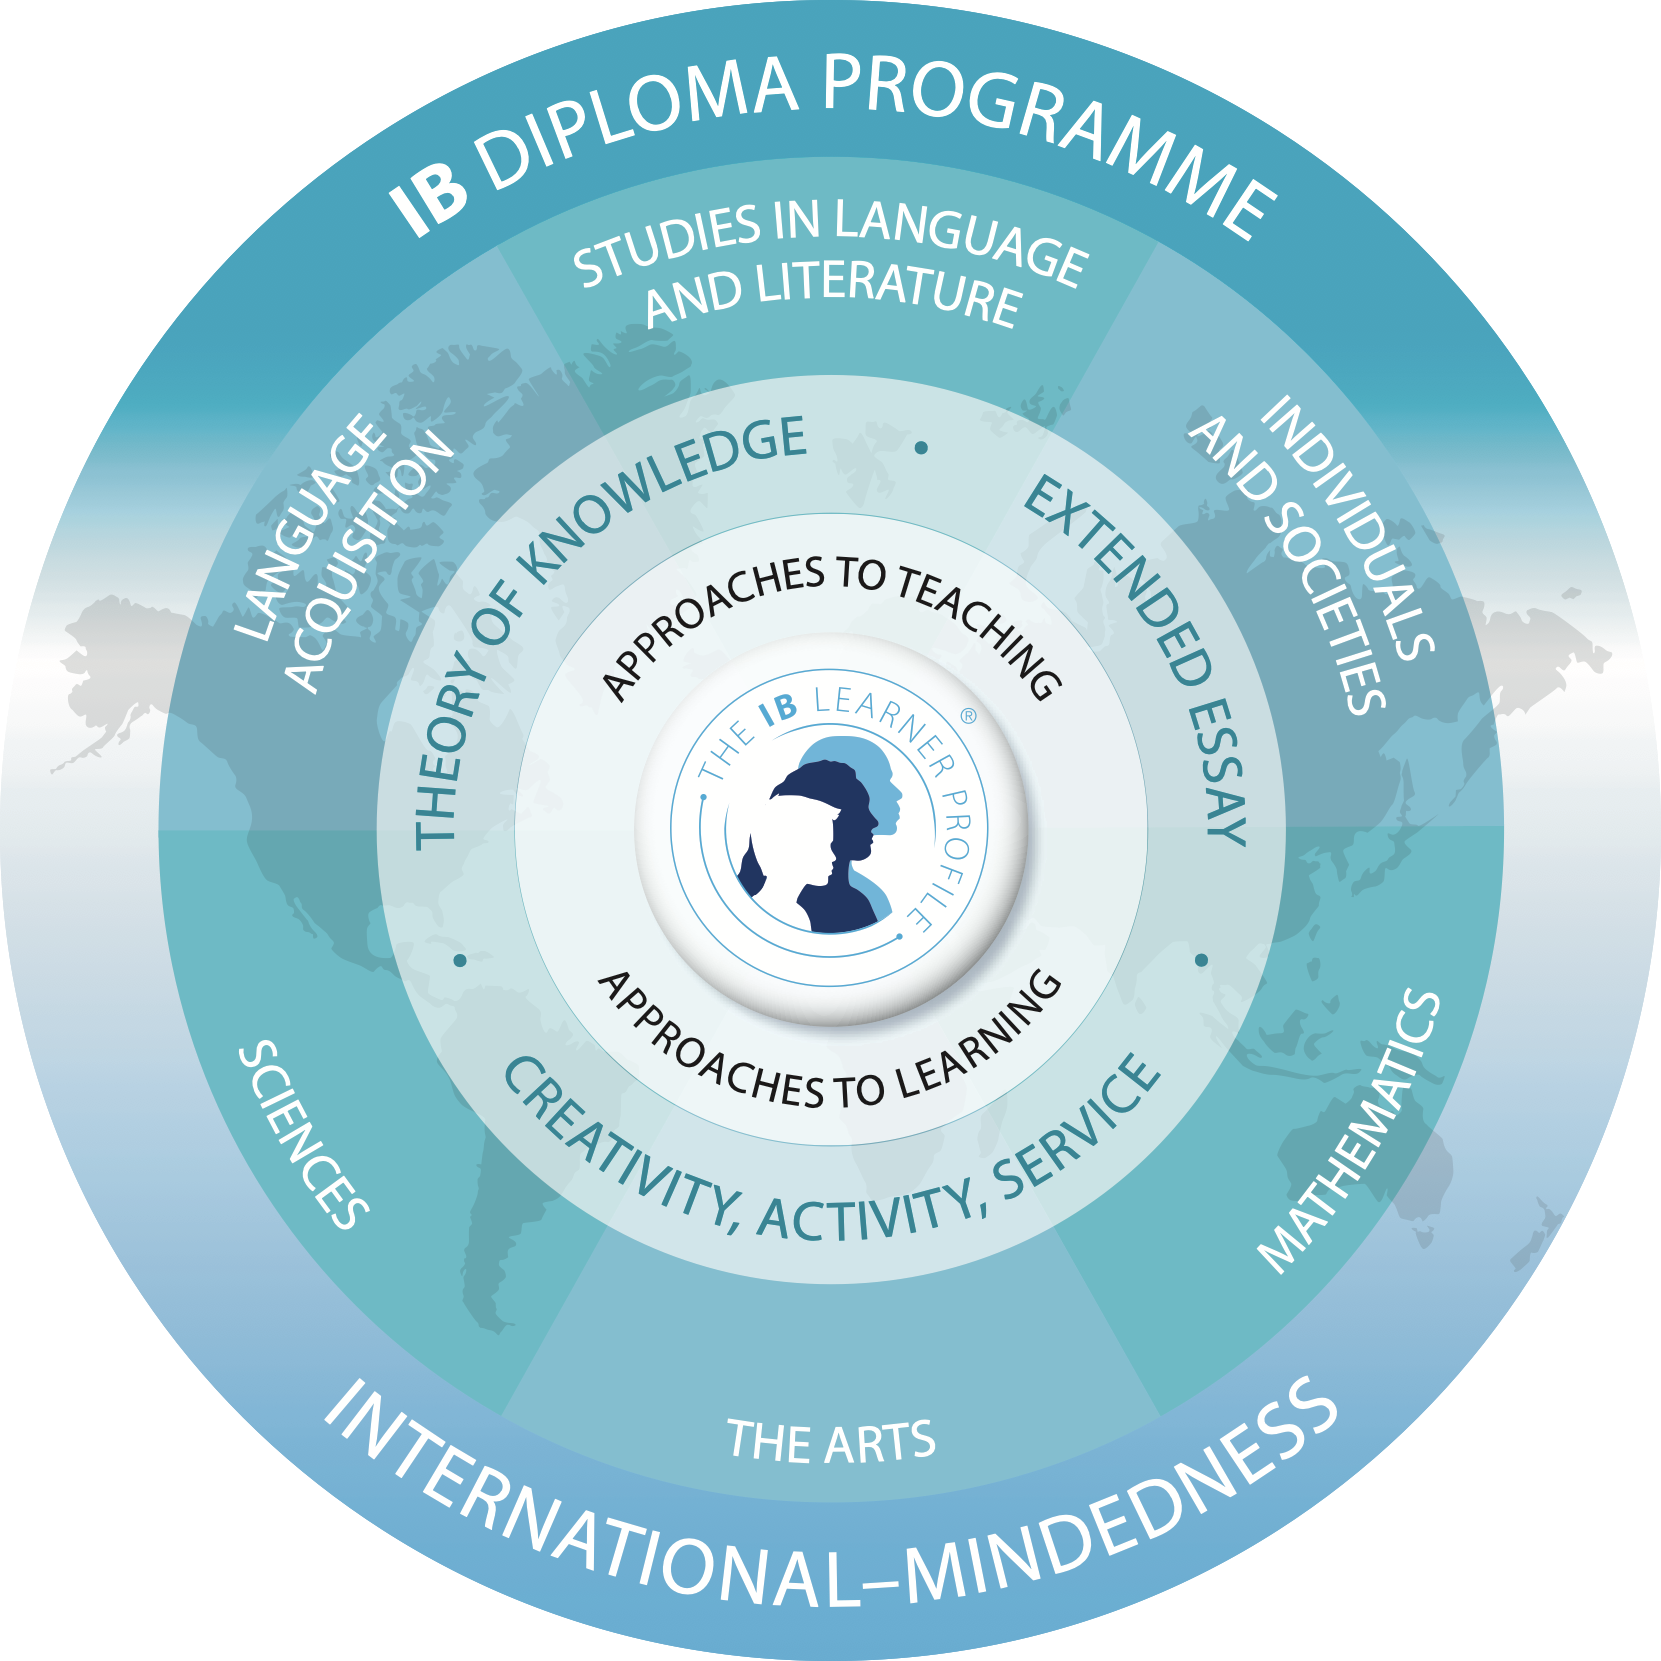
In a data-driven world, the integration of mathematics and technology has become essential for solving real-world problems and driving innovation. The International Baccalaureate (IB) Diploma Programme (DP) offers two distinct mathematics courses to cater to students with different needs, interests, and abilities. Among them, Mathematics: Applications and Interpretation (IB Math AI) is designed for students who prioritize the application and modeling of mathematics in real-life contexts. This course emphasizes data analysis, statistics, technological applications, and the practical use of mathematics across various disciplines. It is particularly suitable for students planning to pursue careers in social sciences, biological sciences, business, environmental sciences, and information technology.
Course Features and Learning Goals
The Mathematics AI course focuses on the real-world application of mathematics, emphasizing data analysis, mathematical modeling, and the use of technological tools. Students will learn how to translate mathematical concepts into real-world problems and apply appropriate methods to analyze, interpret, and solve them. Additionally, the course encourages students to develop critical thinking and creative problem-solving skills, fostering the ability to apply mathematics flexibly in multidisciplinary and real-life contexts.
The key objectives of the Mathematics AI course include:
- Develop an interest in mathematics and understand its value in modern society
- Enhance data analysis, statistical, and modeling skills to solve real-world problems
- Gain proficiency in using technological tools to explore mathematical concepts and improve mathematical interpretation and communication
- Strengthen logical reasoning and critical thinking skills, applying them to interdisciplinary contexts
- Understand how mathematics influences and connects with technology, social sciences, business, and environmental sciences
Course Structure and Study Hours
The Mathematics AI course is offered at two levels: Standard Level (SL) and Higher Level (HL). The HL curriculum is more in-depth and challenging, designed for students who wish to explore mathematical concepts at a greater level of complexity. The course covers five major areas of mathematics:
| Syllabus Component | SL (hours) | HL (hours) |
|---|---|---|
| Number and Algebra | 16 | 29 |
| Functions | 31 | 42 |
| Geometry and Trigonometry | 18 | 46 |
| Statistics and Probability | 36 | 52 |
| Calculus | 19 | 41 |
| Internal Exploration | 30 | 30 |
| Total Hours | 150 | 240 |
Assessment
The final assessment for IB Mathematics AA consists of both external examinations and an internal assessment (IA). The external exams include a mix of short-answer and extended-response questions, requiring students to demonstrate both computational skills and mathematical reasoning.
| Type of Assessment | SL (hours) | HL (hours) | Weight (%) (SL / HL) |
|---|---|---|---|
| External | |||
| Paper 1 – technology allowed | 1.5 | 2 | 40% / 30% |
| Paper 2 – technology allowed | 1.5 | 2 | 40% / 30% |
| Paper 3 – HL only; technology allowed | – | 1 | – / 20% |
| Internal | |||
| Exploration | 15 | 15 | 20% / 20% |
The Internal Assessment (IA) allows students to choose a mathematical topic of interest, conduct research, and write a report demonstrating their understanding and ability to apply mathematical concepts.
Who Should Choose Mathematics AI?
The Mathematics AI course is ideal for students interested in data analysis, mathematical applications, and the use of technological tools, particularly those who:
- Plan to pursue studies in business, economics, social sciences, biological sciences, environmental sciences, information technology, or other fields closely related to the application of mathematics.
- Enjoy solving real-world problems using data, modeling, and technology and are interested in how mathematics is applied across various disciplines and real-life contexts.
- Aspire to develop analytical and decision-making skills, applying mathematics in their future careers to interpret phenomena, predict trends, and optimize outcomes.
Study Tips for IB Mathematics AI
Successfully learning IB Mathematics AA requires a strong mathematical foundation and effective study strategies. Here are some key tips to help you navigate the course smoothly:
- Mastering Concepts and Applications:The Mathematics AI course emphasizes the application of mathematics in real-world contexts, rather than just performing calculations. When studying, it is important not only to memorize formulas but also to understand their meanings, applications, and connections to other concepts. Try using data, graphs, and real-life examples to analyze mathematical problems, fostering the ability to apply knowledge flexibly.
- Practice and Review Regularly:Mathematics is best learned through continuous practice. Develop a study plan that includes problem-solving and past paper practice to familiarize yourself with different question types and exam formats. Regular review sessions will reinforce long-term retention and understanding.
- Utilizing Technological Tools:The Mathematics AI course emphasizes the use of tools such as Desmos, GeoGebra, and Graphing Display Calculators (GDC) to solve problems. Becoming proficient in these tools will help you visualize functions, statistical analyses, and data modeling, ultimately improving your learning efficiency.
- Developing Data Analysis and Modeling Skills:The course covers applications in statistics, probability, and data modeling. You can enhance your learning by interpreting real-world data, such as analyzing financial trends, demographic statistics, or environmental changes, connecting mathematical knowledge with practical problems.
- Explore Additional Resources:Go beyond the textbook by using online courses, instructional videos, and supplementary textbooks. These extra resources can provide alternative explanations and additional practice opportunities to strengthen your understanding.
- Manage Time and Stress Effectively:The AA curriculum is extensive and challenging. Create a structured study schedule, allocate time wisely, and avoid last-minute cramming. Managing your workload efficiently will help reduce stress and improve performance.
- Communicate with Your Teacher:Regularly discuss concepts and seek feedback from your math teacher. Their insights and guidance can help clarify difficult topics and improve your problem-solving approach.
- Focus on the Internal Assessment (IA):The IA is a key part of the course, requiring independent mathematical exploration. Choose a topic that interests and challenges you. Ensure that your research is thorough, your explanations are clear, and your data analysis is well-supported.
- Stay Curious and Engaged:Develop a genuine interest in mathematics by exploring problems beyond the syllabus. A curious and proactive approach will not only keep you motivated but also expand your mathematical knowledge and creativity.
Detailed Course Content
Below is a structured overview of the IB Mathematics AI SL syllabus, based on the Oxford textbook:
1. Measuring space: accuracy and 2D geometry
- 1.1 Measurements and estimates
- 1.2 Recording measurements, significant digits and rounding
- 1.3 Measurements: exact or approximate?
- 1.4 Speaking scientifically
- 1.5 Trigonometry of right-angled triangles and indirect measurements
- 1.6 Angles of elevation and depression
2. Representing space: non-right angled trigonometry and volumes
- 2.1 Trigonometry of non-right triangles
- 2.2 Area of triangle formula. Applications of right and non-right angled trigonometry
- 2.3 Geometry: solids, surface area and volume
3. Representing and describing data: descriptive statistics
- 3.1 Collecting and organising univariate data
- 3.2 Sampling techniques
- 3.3 Presentation of data
- 3.4 Bivariate data
4. Dividing up space: coordinate geometry, lines, Voronoi diagrams
- 4.1 Coordinates, distance and midpoint formula in 2D and 3D
- 4.2 Gradient of lines and its applications
- 4.3 Equations of straight lines; different forms of equations
- 4.4 Parallel and perpendicular lines
- 4.5 Voronoi diagrams and toxic waste problem
5. Modelling constant rates of change: linear functions
- 5.1 Functions
- 5.2 Linear Models
- 5.3 Arithmetic Sequences
- 5.4 Modelling
6. Modelling relationships: linear correlation of bivariate data
- 6.1 Measuring correlation
- 6.2 The line of best fit
- 6.3 Interpreting the regression line
7. Quantifying uncertainty: probability, binomial and normal distributions
- 7.1 Theoretical and experimental probability
- 7.2 Representing combined probabilities with diagrams
- 7.3 Representing combined probabilities with diagrams and formulae
- 7.4 Complete, concise and consistent representations
- 7.5 Modelling random behaviour: random variables and probability distributions
- 7.6 Modelling the number of successes in a fixed number of trials
- 7.7 Modelling measurements that are distributed randomly
8. Testing for validity: Spearman’s hypothesis testing and χ² test for independence
- 8.1 Spearman’s rank correlation coefficient
- 8.2 χ² test for independence
- 8.3 χ² goodness-of-fit test
- 8.4 The t-test
9. Modelling relationships with functions: power functions
- 9.1 Quadratic models
- 9.2 Problems involving quadratics
- 9.3 Cubic models, power functions and direct and inverse variation
- 9.4 Optimisation
10. Modelling rates of change: exponential and logarithmic functions
- 10.1 Geometric sequences and series
- 10.2 Compound interest, annuities, amortization
- 10.3 Exponential models
- 10.4 Exponential equations and logarithms
11. Modelling periodic phenomena: trigonometric functions
- 11.1 An introduction to periodic functions
- 11.2 An infinity of sinusoidal functions
- 11.3 A world of sinusoidal models
12. Analyzing rates of change: differential calculus
- 12.1 Limits and derivatives
- 12.2 Equation of tangent and normal and increasing and decreasing functions
- 12.3 Maximum and minimum points and optimisation
13. Approximating irregular spaces: integration
- 13.1 Finding areas
- 13.2 Integration: the reverse process of differentiation
Below is a structured overview of the IB Mathematics AI HL syllabus, based on the Oxford textbook:
1. Measuring space: accuracy and geometry
- 1.1 Representing numbers exactly and approximately
- 1.2 Angles and triangles
- 1.3 Three-dimensional geometry
2. Representing and describing data: descriptive statistics
- 2.1 Collecting and organizing data
- 2.2 Statistical measures
- 2.3 Ways in which we can present data
- 2.4 Bivariate data
3. Dividing up space: coordinate geometry, lines, Voronoi diagrams, vectors
- 3.1 Coordinate geometry in 2 and 3 dimensions
- 3.2 The equation of a straight line in 2 dimensions
- 3.3 Voronoi diagrams
- 3.4 Displacement vectors
- 3.5 The scalar and vector product
- 3.6 Vector equations of lines
4. Modelling constant rates of change: linear functions and regressions
- 4.1 Functions
- 4.2 Linear models
- 4.3 Inverse functions
- 4.4 Arithmetic sequences and series
- 4.5 Linear regression
5. Quantifying uncertainty: probability
- 5.1 Theoretical and experimental probability
- 5.2 Representing combined probabilities with diagrams
- 5.3 Representing combined probabilities with diagrams and formulae
- 5.4 Complete, concise and consistent representations
6. Modelling relationships with functions: power and polynomial functions
- 6.1 Quadratic models
- 6.2 Quadratic modelling
- 6.3 Cubic functions and models
- 6.4 Power functions, inverse variation and models
7. Modelling rates of change: exponential and logarithmic functions
- 7.1 Geometric sequences and series
- 7.2 Financial applications of geometric sequences and series
- 7.3 Exponential functions and models
- 7.4 Laws of exponents – laws of logarithms
- 7.5 Logistic models
8. Modelling periodic phenomena: trigonometric functions and complex numbers
- 8.1 Measuring angles
- 8.2 Sinusoidal models: \(f(x)=asin(b(x−c))+d\)
- 8.3 Completing our number system
- 8.4 A geometrical interpretation of complex numbers
- 8.5 Using complex numbers to understand periodic models
9. Modelling with matrices: storing and analyzing data
- 9.1 矩Introduction to matrices and matrix operations
- 9.2 Matrix multiplication and properties
- 9.3 Solving systems of equations using matrices
- 9.4 Transformations of the plane
- 9.5 Representing systems
- 9.6 Representing steady state systems
- 9.7 Eigenvalues and eigenvectors
10. Analyzing rates of change: differential calculus
- 10.1 Limits and derivatives
- 10.2 Differentiation: further rules and techniques
- 10.3 Applications and higher derivatives
11. Approximating irregular spaces: integration and differential equations
- 11.1 Finding approximate areas for irregular regions
- 11.2 Indefinite integrals and techniques of integration
- 11.3 Applications of integration
- 11.4 Differential equations
- 11.5 Slope fields and differential equations
12. Modelling motion and change in 2D and 3D: vectors and differential equations
- 12.1 Vector quantities
- 12.2 Motion with variable velocity
- 12.3 Exact solutions of coupled differential equations
- 12.4 Approximate solutions to coupled linear equations
13. Representing multiple outcomes: random variables and probability distributions
- 13.1 Modelling random behaviour
- 13.2 Modelling the number of successes in a fixed number of trials
- 13.3 Modelling the number of successes in a fixed interval
- 13.4 Modelling measurements that are distributed randomly
- 13.5 Mean and variance of transformed or combined random variables
- 13.6 Distributions of combined random variables
14. Testing for validity: Spearman’s hypothesis testing and χ² test for independence
- 14.1 Spearman’s rank correlation coefficient
- 14.2 Hypothesis testing for the binomial probability, the Poisson mean and the product moment correlation coefficient
- 14.3 Testing for the mean of a normal distribution
- 14.4 Chi-squared test for independence
- 14.5 Chi-squared goodness-of-fit test
- 14.6 Choice, validity and interpretation of tests
15. Optimizing complex networks: graph theory
- 15.1 Constructing graphs
- 15.2 Graph theory for unweighted graphs
- 15.3 Graph theory for weighted graphs: the minimum spanning tree
- 15.4 Graph theory for weighted graphs – the Chinese postman problem
- 15.5 Graph theory for weighted graphs – the travelling salesman problem